
PerfView
Explore system and application performance deeply
Description
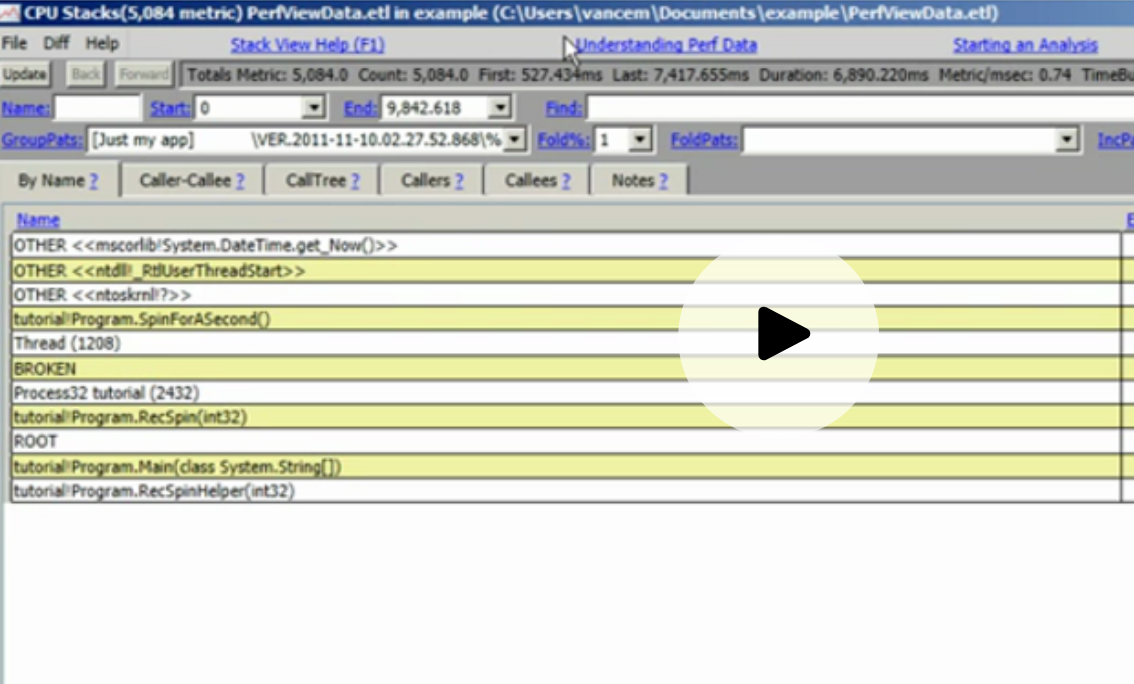
PerfView offers in-depth exploration of system and application performance through ETW information and CLR memory analysis. It facilitates the collection and viewing of data from ETL files and heap dumps in an accessible setup, with a key focus on CPU performance. Uncover hidden issues, track down resource usage, and utilize comprehensive profiling features to improve code efficiency and reliability in a user-centric manner.
Screenshots
Click to view full size